- Air Homepage
- Alberta Air Quality
- One Person Is in Charge
- Advanced Analytical Techniques
Advanced Analytical Techniques for Mastering Air Quality: Unveiling Precision
Find out about air quality monitoring and advanced analytical techniques with Calvin Consulting Group Ltd. We show how to calibrate ambient air analyzers, ensuring accuracy in ozone, carbon monoxide, nitrogen oxides, sulfur dioxide, and more. Here's how to calibrate orifice units and high-volume air samplers.
AMD Calibration and LSR Analysis Beyond the Sensor - Do you think your air quality readings are accurate enough to meet regulatory standards? Using Least Square Regression and Gas Phase Titration, you'll get bulletproof CAAQM data.
 I'm gonna need some help...
Learn how to use advanced techniques like Least Square Regression (LSR), dynamic calibration, and permeation devices. Calculate methane equivalent, gas phase titration, and high-volume samplers with capillary and orifice systems.
Since 2007, we've done over 200 relevant Quality Assurance Plans. Contact us via email for comprehensive insights and expertise.
This article summarizes the ten appendices in Chapter 7 of the Alberta Air Monitoring Directive, which addresses air monitoring equipment calibration. Here's the original document, and here's a summary on Stuff in the Air.
It's important to monitor air quality accurately and reliably for public health and the environment. Air quality analyzers perform better with analytical techniques. In this article, we'll explore real-world applications of least square regression, dynamic calibration, and gas phase titration.
Appendix A - Procedure for Evacuating a Regulator
It's important to remove oxygen and other contaminants before using a pressure regulator. Here's how:
Connect the equipment:
- Connect the regulator to the cylinder.
- Make sure the cylinder valve is closed before connecting a vacuum pump to the regulator outlet.
How to evacuate:
- Pump up the vacuum.
- Let the system evacuate for at least five minutes after opening the outlet port.
- Make sure the evacuation port is closed.
Charge the regulator:
- Charge the regulator by slowly opening and closing the cylinder valve.
For assurance, repeat:
- Make sure you do the evacuation (step 2) and charging (step 3) at least three more times.
- Oxygen and impurities are completely removed from the regulator this way.
- In this way, the regulator is thoroughly purged and ready to go.
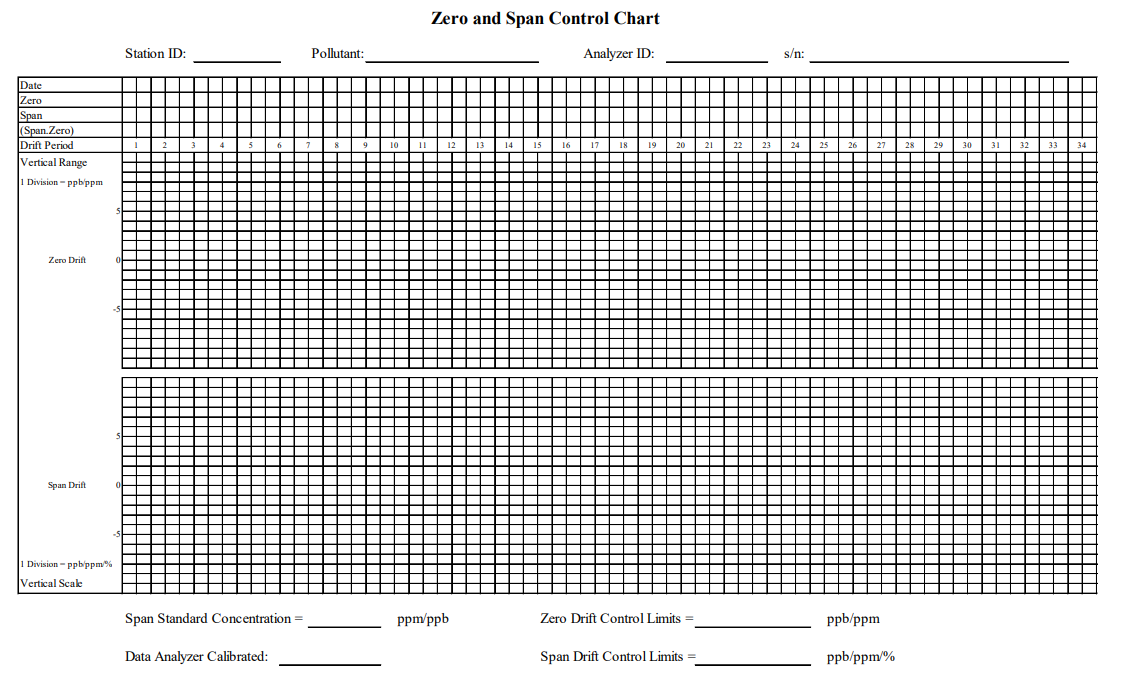
Appendix B - Example of a Zero and Span Control Chart Include Image
Record calibration data with a Zero and Span Chart. By doing this, we can tell if our air quality instruments are reliable and can detect pollution accurately. See this example:

Users can help keep our air clean and safe if they follow the guidebook!
Appendix C - Advanced Analytical Techniques using Least Square Regression Analysis
The LSR technique establishes a relationship between a dependent variable (e.g., pollutant concentration) and an independent variable (e.g., temperature). Here are some techniques:
- Air quality analyzers are calibrated by establishing a relationship between their response and pollutants' concentrations.
- Data from air quality monitoring networks is analyzed by LSR to find trends, patterns, and correlations.
- Take this example: LSR was used to calibrate particulate matter analyzers in a case presented in the Journal of Air and Waste Management. PM measurements improved by 25% with LSR.
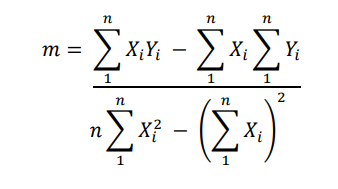
In this analysis, you can see how well an analyzer is performing compared to its calibration. Calibration curves are calculated by calculating slope, intercept, and correlation coefficient.
The variables are:
y - Analyzer response (what the machine says).
x - The independent variable is the concentration calculated or audited (the real value).
Equation of regression:
y=mx+b
Also:
m (slope): Calculates how much the analyzer deviates from calibration.

Here,
- Yi = individual reading of the analyzer
- Xi = individual calibration value (true value)
- n = number of calibration points
b (intercept): Displays the analyzer's zero offset.
- b = average (X's) -m x average (Y's)
- Calculations:
The linear regression is just an approximation, and a correlation coefficient R tells you how linear it is.

Interpretation:
- Slope: Measures how much the analyzer reading differs from the calibration (e.g., 1.10 means 10% high).
- Intercept: Reflects the zero offset of the analyzer (e.g., +0.05 indicates a positive offset).
- Correlation Coefficient (R): Indicates the degree of linearity (how well the data fits a straight line).
These advanced analytical techniques help ensure the accuracy and reliability of the analyzer by comparing its readings to the expected calibration values.
Appendix D: Calculation - Dynamic Calibration Using a Permeation Device
Real-time calibration of air quality analyzers takes changing environmental conditions into account. Here's how it works:
- Real-time monitoring of air quality is made possible through dynamic calibration, which adjusts the analyzer's response to changing conditions.
- Improved accuracy: Dynamic calibration reduces interference from the environment.
- Here's an example: Using dynamic calibration to improve ozone measurements was published in the Journal of Environmental Monitoring. Ozone measurements were reduced by 30% with dynamic calibration.
Here's how to calculate the permeation rate for a calibration:
Formula for permeation rate:
Here's how to calculate Permeation Rate (PT) in nanograms/minute:
Pt = F x C/Km
Pt: Permeation rate (ng/minute)
F: The flow rate in cubic centimeters/minute at STP (Standard Temperature and Pressure).
C: Concentration (Volume) in ppm
Km: The molar constant (24.46 divided by the molecular weight)
Thus Concentration (ppm) = Pt x Km/F
Example Values:
Common gases like Hydrogen Sulfide, Nitrogen Dioxide, and Sulphur Dioxide have molecular weights of 34.08, 46.01 and 64.07 (g/mol) respectively.
Advanced analytical techniques ensure accurate readings from the permeation device by determining the concentration of specific gases during calibration.
Appendix E: Dilution Calibration Calculation
This set of advanced analytical techniques helps you calculate calibration gas concentration after dilution:
Here's the formula:
CF = (Fc x Cs)/Ft
CF: In ppm (parts per million), output concentration
Cs: Diluted compressed gas concentration in ppm
Fc: Gas flow corrected to STP (Standard Temperature and Pressure)
FD: Zero gas flow (dilution air) corrected to STP
Ft: Total flow (sum) of FCs and FDs
Calculating the final concentration of calibration gas after it's diluted ensures accurate readings during calibration.
Appendix F: Flow Measurements and Corrections - Bubble Flow Meter
Here's how to measure mass flow using a bubble flow meter, correcting for temperature, atmospheric pressure, and water vapor pressure:
Technique for Bubble Flow Meters:
- Gas mass flow is measured with this method.
- It's measured in standard cubic centimeters per minute (standard cc/min).
Mass Flow (standard cc⁄min)
= Volume (cc)/Time (min) × (P − Pv)/760 × 298/T (Kelvin)
P is the atmospheric pressure (in mm of mercury)
Pv the vapour pressure of water, which depends on temperature and you can look up online or in the table in Appendix F
T the gas temperature
 Let your imagination run wild
The correction involves referencing a table with Values for T and PV. When using bubble flow meters, this correction accounts for temperature, atmospheric pressure, and water vapor pressure.
Calibration and maintenance of linear mass flow meters:
Mass flow meters are usually stable, but you should calibrate them periodically. Here's a quick summary for
keeping things stable:
- Mass flow meters are generally stable, but it's good to check your calibration:
- To make sure accuracy, periodic calibration checks are a good idea.
- Make sure the unit is measuring at multiple points.
Here's how to use a bubble flow meter:
- Calibration checks can be done with a bubble flow meter.
Accuracy considerations:
- Sensors can get clogged or inaccurate when there are particles in the gas stream.
- Maintaining accuracy and stability requires proper flow filtration.
Regularly checking and calibrating linear mass flow meters, especially bubble flow meters, ensures their accuracy and reliability. For long-term stability, you need good flow filtration.
Temperature and atmospheric pressure need to be corrected when using a rotameter. Here's a quick summary:
Equation for correction:
Fstp = Famb × Pa/760 × sqrt(298/Ta)
Fstp = Mass flow Standard Temperature and Pressure (STP) with this equation:
Famb = Volumetric flow from the manufacturer's curve
Pa = Barometric pressure (mm of Hg)
Ta = Ambient Temperature (K)
Characteristics of rotameters:
- A Rotameter is a field-portable device with moderate accuracy.
- Air density affects accuracy, so STP corrections are crucial.
Buildup of contaminants:
- The accuracy can be affected by contaminants on the tube walls and indicator ball.
- It's important to keep the air stream clean.
Cross-checking and cleaning:
- Methanol can be used to clean rotameters.
- Check the rotameter every 6 months with a bubble flow meter or mass flow meter.
Advanced analytical techniques include temperature and pressure corrections, which are essential for accurate mass flow measurements with a rotameter. The device's reliability in the field is ensured by regular cleaning and cross-checking.
Finally, Capillary and orifice calibration systems use flow restrictors and pressure differential-flow curves. Here's a quick summary:
The working principle is:
- Flow restrictors (capillaries or orifices) are used in these systems.
- Flow rate is predetermined in the design.
Accuracy and sensitivity:
- The diameter of the restrictor is proportional to the fourth power in these systems.
- Pressure gauge accuracy can be affected by repeatability.
Considerations for accuracy:
- The accuracy of these systems isn't great because of sensitivity and repeatability issues.
- Compared to other calibration methods, cross-checking flows is recommended more often.
Generation of calibration standards:
- In order to generate a calibration standard, the system should maintain a constant flow.
- It's best to use reliable tools like a bubble flow meter or mass flow meter to measure the flow.
Capillary and orifice systems offer predetermined flow rates, but they have sensitivity and repeatability challenges. Maintaining reliability requires advanced analytical techniques, regular cross-checks and accurate flow measurement tools.
Appendix G Methane Equivalent Calculation - Here's a quick guide to calculating methane equivalents
Here's how to calculate the methane equivalent of a hydrocarbon gas mixture:
The methane equivalent =
(Molecular weight of hydrocarbon gas) / (Molecular weight of methane)
Here's an example:
- Let's say we have a calibration mixture with 1.40 ppm propane (C3H8), 5.00 ppm methane (CH4), and zero air.
The calculation is:
- There's 44.09 molecular weight in C3H8 because
- CH4 has a molecular weight of 16.04
- Plug these values into the formula:
- A methane equivalent is (44.09/16.04) × 1.40 ppm) + 5 ppm
...which is 8.85 ppm. By using advanced analytical techniques and comparing measurements to methane equivalents, we standardize measurements for easy comparison.
Appendix H Gas Phase Titration Calculations
Atmospheric gas concentrations are measured by GPT. Among the techniques are:
- By reacting the gas with a known amount of reagent, the GPT measures gas concentrations accurately.
- Due to its low detection limits, GPT can detect trace levels of gases.
- As an example: Nitrogen dioxide (NO2) in urban air was measured using GPT in a study published in the Journal of Chromatography. GPT measured NO2 accurately with a detection limit of 1 ppb.
Nitric oxide (NO) concentration:
Cf = Fc x Cs / Ft
Where:
Cf = concentration of output (ppm)
Cs = NO concentration in compressed gas (ppm)
Fc = NO flow at STP
Fd = STP dilution flow
Ft = total flow at STP (Fc + Fd)
Here's how to determine ozone O3 concentration:
O3 = NOi + NOii
Where:
NOi = NO concentration before O3 introduction
NOii = NO concentration after O3 introduction
When O3 concentration is known, you can determine NO2 concentration by:
The NOi minus NOii equals NO2 (then O3 = NO2)
Not all analyzer NOx converters are 100% efficient, so it's important to estimate converter efficiency.
Efficiency = NO2 increase × 100% / NO decrease
Appendix I High Volume Sampler Calculations
These advanced analytical techniques provide a quick overview of high volume sampler calculations
Orifice calibration:
- You can calculate True Air Volume (Va) with this formula:
Va = (Pm / Pa) x Vm
Va - (At atmospheric temperature) is the true volume of air
Pa - Barometric pressure
Pm - The pressure drop at the inlet to the reference orifice
Vm - The volume measured using the standard orifice
 Getting precise data requires calibration
The true flow rate is:
Q = Va / T
Q: What's the air flow rate?
T: minutes of sampling
Volume of sample:
V = QT
V = Sampled air volume
Q = the average sampling rate
T = sampling time
Now for temperature / pressure corrections:
Correct the flow rate Q if pressure or temperature differ during calibration:
Q2 = Q1 × √((T2 P1) / (T1 P2))
Where:
Q2 = Corrected flow rate in
Q1 = Flow rate during high volume calibration
T1 and T2 are absolute temperatures (K) during orifice unit and high volume calibrations respectively while
P1 and P2 are barometric pressures during those same two calibrations.
Particulate Mass Concentration Calculation:
S.P. = (W2 - W1) / V
Where:
S.P. : suspended particulate mass (µg/m3)
W1: initial filter weight (g)
W2: final filter weight (g)
V: barometric pressure during calibration
Multiply the result by a million to get µg/m3
Please note that all measurements are reported with specific precision (e.g., to the nearest 0.1 milligram), and mass concentrations are reported to the nearest microgram.
Appendix J - Simplified Example of a Calibration Report
See the image in Appendix J of the chapter. It's like a report card for the air quality measuring equipment. Let's take a look at what it would include:
Instrument identification:
- Details about the equipment being checked, like the make/model, serial number, and when it was last calibrated.
Method of calibration:
- Describes how the calibration was done, like using certain gases.
Calibration conditions:
- Temperature and barometric pressure are recorded during calibration.
Results of calibration:
- Compares what the equipment was supposed to read with what it actually measured. Check if the "ruler" shows the right "length."
Factor for correction:
- This factor helps adjust the readings if the equipment is off.
- Calibration data from the past and the present:
- Make sure the results are consistent with the last calibration.
The calibration curve and analysis:
- Analyzes how well the equipment is performing with a visual representation.
The person who did the calibration:
- It includes the name of the calibration person, the location and the date.
Remember, calibration and other advanced analytical techniques make sure the equipment gives accurate readings, just like checking if your watch shows the right time. Over time, the report helps track the equipment's health and performance.
Need help getting started?
Calvin Consulting Group Ltd. helps industrial facilities comply with air quality reporting requirements by providing expert consulting services in Quality Assurance Plans (QAP) and Air Monitoring Directives (AMD).
Air quality reporting systems are detailed in our AMD QAPs, which are audited every three years. Air quality instruments need to be reliable, so we're here to help with advanced analytical techniques like Zero and Span Charting, Least Square Regression, and Dynamic Calibration.
We can provide personalized consultation to contribute to cleaner air and regulatory compliance. Just let me know at...

With advanced analytical techniques, you can explore the intricacies of air quality monitoring.
Expertise in precise measurements, from orifice calibration to high-volume sampler calculations. Learn about least square regression, dynamic calibration, and permeation devices.
Do you have concerns about air pollution in your area??
Perhaps modelling air pollution will provide the answers to your question.
That is what I do on a full-time basis. Find out if it is necessary for your project.
Have your Say...
on the StuffintheAir facebook page
Other topics listed in these guides:
The Stuff-in-the-Air Site Map
And,
Thank you to my research and writing assistants, ChatGPT and WordTune, as well as Wombo and others for the images.
OpenAI's large-scale language generation model (and others provided by Google and Meta), helped generate this text. As soon as draft language is generated, the author reviews, edits, and revises it to their own liking and is responsible for the content.


New! Comments
Do you like what you see here? Please let us know in the box below.