- Air Homepage
- About Us
- Satellite Images
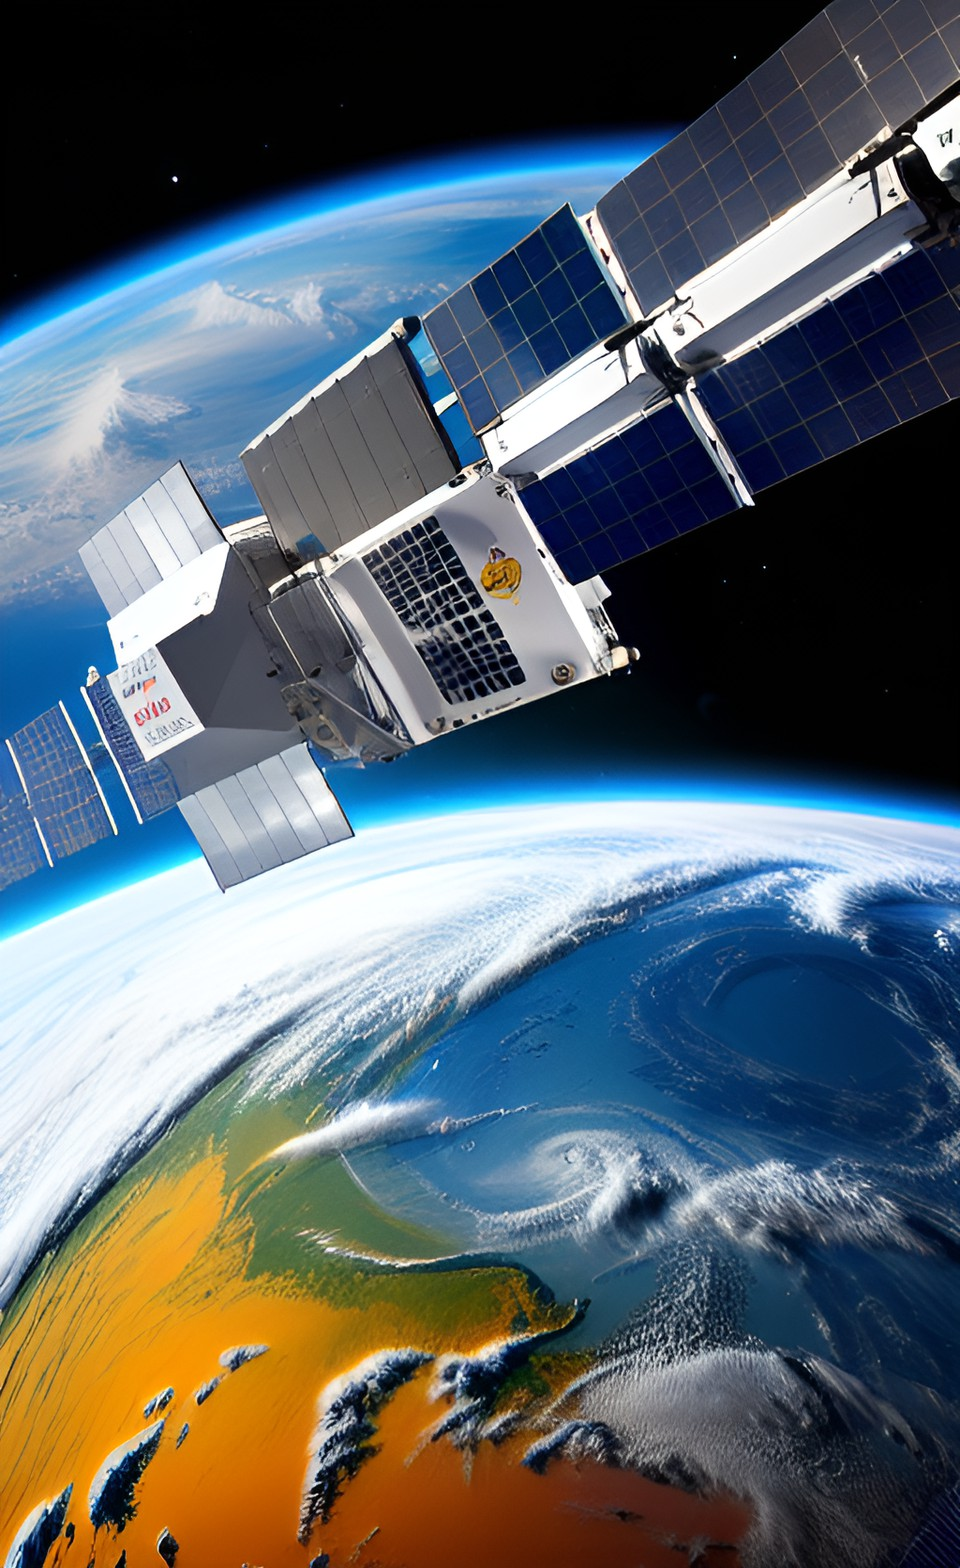
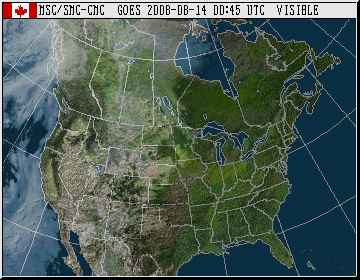
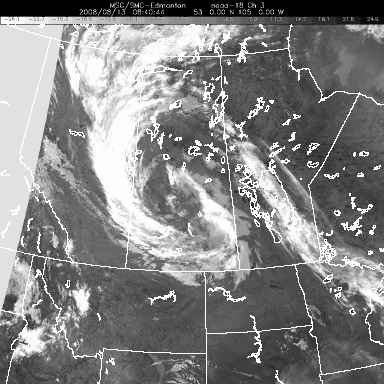
A variety of satellite images
More about weather satellites.
Have you seen the satellite images on a weather report? Way up there in space (remember David Bowie?)
Do these images and their associated spectrum wavelengths matter? Maybe so...check out these reasons:
- Satellite photos can tell you a lot about weather patterns, like cloud cover, precipitation, and temperature. Meteorologists use this info to forecast weather and issue severe weather warnings.
- Land use, vegetation cover, and water resources can be monitored with satellite images. It's important for managing natural resources and identifying areas at risk of degradation.
- Satellite images can be used to assess natural disasters like hurricanes, floods, and wildfires. To plan and coordinate disaster response efforts, emergency responders and aid organizations need this information.
- Monitoring the environment: Images generated by satellites can be used to monitor air and water quality, and track changes in ecosystems. We need this info to understand how human activities affect the environment and develop policies to mitigate them.
- Satellite images can be used to gather intelligence and monitor military activities. National security and defense need this info.
Satellite images can also provide valuable insights into the properties of objects being observed, like their composition, temperature, and reflectivity, by understanding their varying spectrum wavelengths. Geologists, atmospheric scientists, and astronomers use this information.
See more songs on my Just Me on Piano Youtube channel.
Of course you can have separate images for different geographical areas, but here we look various types of satellite images available.
Satellite equipment examines several ranges of light spectrum wavelengths, all given by the sun and some from the earth as well. These channels are defined by their wavelengths in micrometres, microns. This is one millionth of a metre and denoted by µm.
A wavelength list - Spectral analysis of absorption
Visible, 0.6 m - Reflected solar radiation, light that reflects off the earth and lands on the satellite to give it a realistic look. This is an obvious way to use solar energy.
Reflections, though, are only as good as the surface they bounce off of. Is it angled so the echo gets lost or detected? Does it have a high albedo, so it acts like a mirror? Is it a black body that doesn't return a signal?
Depending on the incoming energy at each point, the computer makes each graphic pixel whiter. Winter is darker and nights are black.
Near-IR, 1.1 m - A hybrid of thermal and visible light. It's great for finding water surfaces and edges on ocean pictures. With our technology, we can combine these images to get fantastic multi-spectral imagery.
Polar orbiting, 3 to 4 m - Lower energy pixels are lighter. Science products and pictures look like cloud tops and colder areas are white with dark tropics and low elevations. Most of the energy comes from terrestrial radiation, with a little direct sunlight.
Water and ice droplets are sensitive to this frequency. When it's cold, low clouds can look black during the day. They're hard to spot on other satellite images and photos.
Water Vapor Channel (WV), 6.7 m - Water vapor absorbs this wavelength very well. An area of high water vapour concentration effectively takes the radiation energy and releases it at its own temperature (wavelength). Satellites can then help us pinpoint moisture's location and temperature.
It's still not perfect. If the plume isn't too thick, surface radiation can get through. Then it's hard to see. Satellite images lack contrast, so they're hard to read.
Warm, humid areas are dark on these satellite pictures, and cold, dry areas are white. Despite everything, this illustration helps us find dampness without clouds.
Infrared (IR), 11 m on GEOS equipment and 12 m on polar orbiting satellites - These wavelengths are not absorbed by
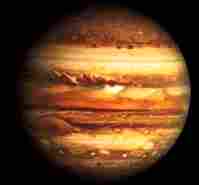
air, so they can see temperatures down to the ground. IR comes from the earth's radiant heat, and even colder Jupiter temperatures...
The fifth planet of the solar system is typically -240°F (-150°C) at cloud tops, but possibly thousands of degrees hidden down on the planet's solid surface whose existence is yet to be determined.
...as well as visible radiation, for example. Meteorologists can customize satellite imagery to highlight and analyze certain temperatures, but usually darker graphics indicate warmer areas and low clouds.
Why does it get dark at night? Check out this video from Five Minute Physics.
Search this site for more information now.
Satellite Images and Emission Spectrums
IR spectrums are blocked by fog frozen droplets or ordinary clouds, but those clouds emit this frequency well. We can use the signal to figure out where the clouds are and how high they are (temperature). Live photo satellite shots are often shown on TV from images generated using this frequency.
If you want to have some more fun with terrestrial satellite images, try maps.google.com.
From weather patterns to natural resources to national security, satellite images and their associated spectrum wavelengths are important tools.
Go back from Satellite Images to the Weather Man page now.
A satellite's ability to provide multiple images at the same time
What is the maximum number of satellite images that a satellite can produce simultaneously? Depending on the number of cameras on board, the answer may vary.
Do you have concerns about air pollution in your area??
Perhaps modelling air pollution will provide the answers to your question.
That is what I do on a full-time basis. Find out if it is necessary for your project.
Have your Say...
on the StuffintheAir facebook page
Other topics listed in these guides:
The Stuff-in-the-Air Site Map
And,
Thank you to my research and writing assistants, ChatGPT and WordTune, as well as Wombo and others for the images.
GPT-4, OpenAI's large-scale language generation model (and others provided by Google and Meta), helped generate this text. As soon as draft language is generated, the author reviews, edits, and revises it to their own liking and is responsible for the content.

New! Comments
Do you like what you see here? Please let us know in the box below.