- Air Homepage
- Upper Atmosphere
- Weather Map Symbols
Weather Map Symbols: Meteorological Analysis
More about weather maps.
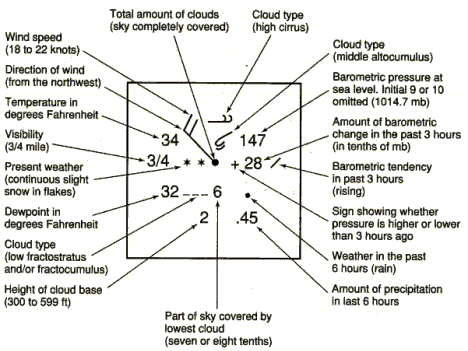
On surface maps meteorologists use these weather map symbols to analyze the weather.
Have you ever wondered what those swirls on weather maps mean? Discover the secrets of vorticity!
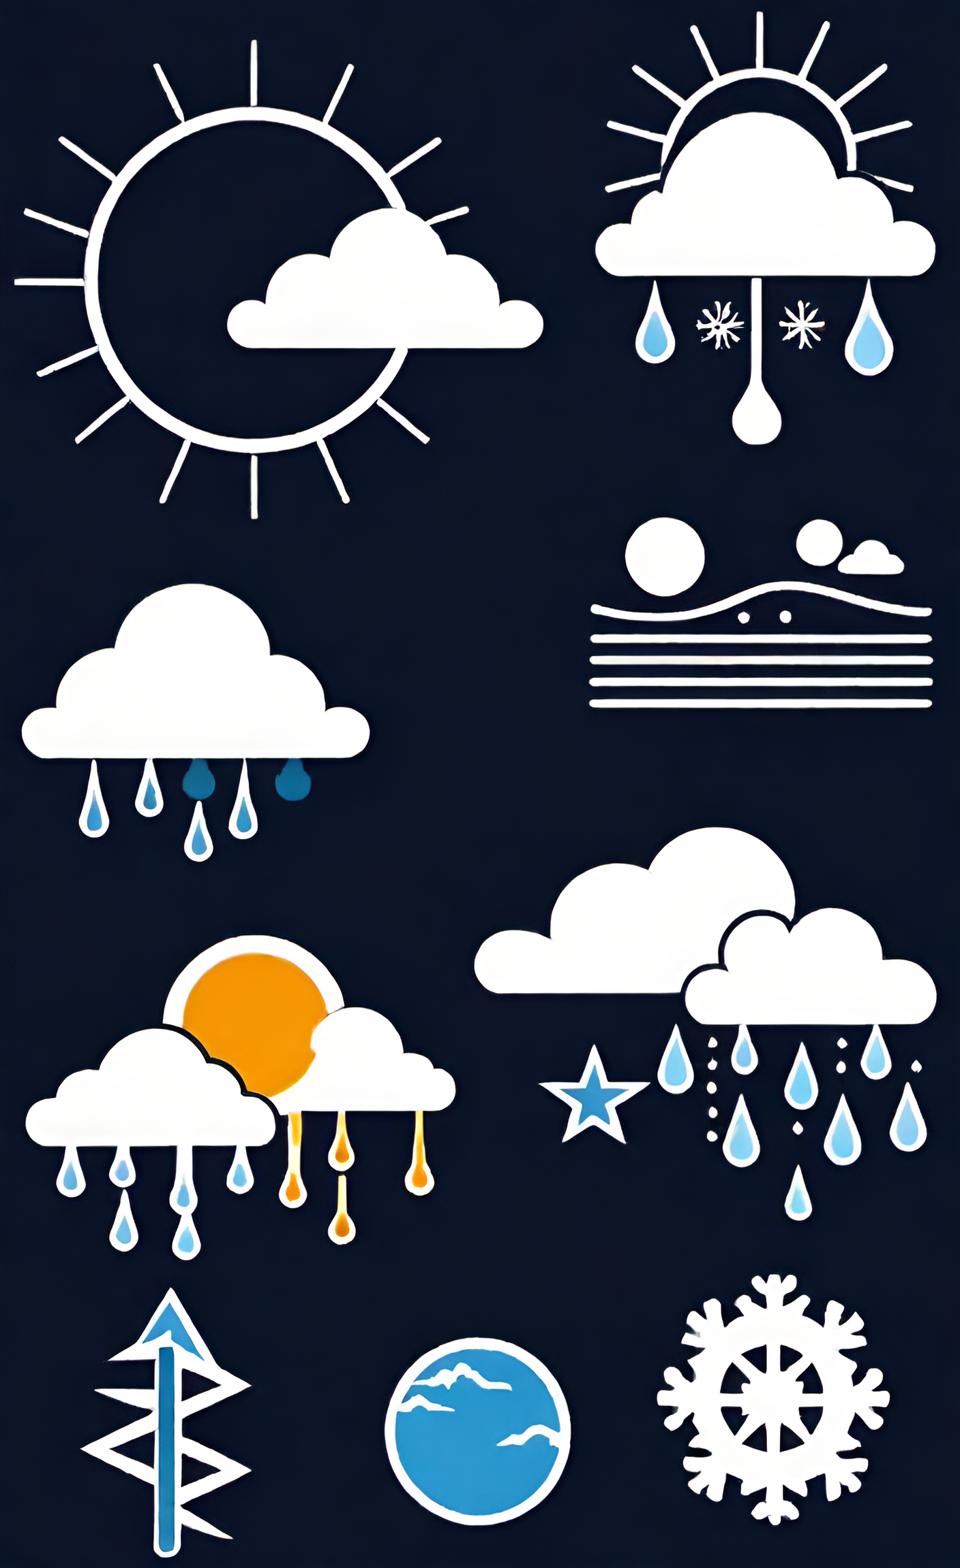 Weather maps are cool
Do you ever stare at a weather map and wonder what the silly graphics mean? There's no need to feel alone! Wouldn't it be awesome if you could crack the code and see weather forecasts like never before?
With this guide to weather maps, you can discover the world of vorticity, cyclones, anticyclones, and even tornadoes!
I've got the symbols meteorologists use to communicate complex weather data so you're always prepared. All this so you can see how vorticity shapes our weather patterns and how it's used to predict everything from clear skies to raging storms.
How the Earth's rotation affects these patterns and how to interpret them: From relative to absolute, meteorologists use vorticity to make accurate forecasts, so you can plan your activities.
You're about to get a whole new weather map experience! Let's unlock those swirls and lines and become weather experts!
A Guide to Vorticity and Forecasting
Here's a few examples. An analytical map usually includes these elements. Let's demystify weather symbols and delve into the science of vorticity patterns.
🌦️ Learn the Visual Language: Meteorologists use simple symbols to communicate complex weather data, so you're always prepared.
🌀 Explore the intricate world of vorticity - the force behind cyclones, anticyclones, and tornadoes. Learn how it's calculated and why it's so important.
🔍 Unravel the mystery of angles and rotations that shape our understanding of atmospheric motion by deciphering the vorticity codes.
❓ Learn how relative and absolute vorticity affect weather.
🌍 Visualize Earth's rotation and how it affects vorticity patterns. You can learn how your latitude affects the dance of the world around you by sticking a pencil through the Earth.
⚙️ Watch how meteorologists analyze vorticity shear, advection, and more to create accurate weather forecasts.
We're going to crack the code of weather map symbols and learn how vorticity can predict everything from clear skies to raging storms. Get ready to see weather forecasts like never before!
Decoding Weather Map Symbols: Understanding Vorticity and Forecasting
They display the data consistently around the world so it's never confusing. How about upper air symbols and patterns on the 500 millibar map? When preparing a weather forecast, meteorologists often start with this map.
Why bother? Weather map symbols help people understand and prepare for potential weather-related hazards by providing a visual representation of weather conditions. Forecasters and meteorologists use these icons to convey complex weather information.
- People care about weather map symbols because they give them valuable information to plan their activities and take precautions. When a person sees a thunderstorm symbol on a weather map, they know to take shelter and avoid outdoor activities. As well, if they see a snowflake symbol, they know to dress warmly.
- Additionally, emergency management officials use weather map symbols to make evacuation decisions, school closures, and other safety measures. During severe weather, members of the public can stay informed and take appropriate action by understanding these symbols. Weather map symbols keep the public informed about weather conditions and help them make informed decisions to protect themselves and their communities.
We're going to explore a specific set of symbols embedded in a map for analysis. There may be atmospheric motions contributing to intense rain or snow.
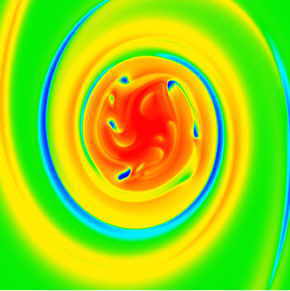
There are faint whirlpools in a quasi-concentric pattern on maps which display these values. Integers mark their central values, ranging from -20 to +40. What do the numbers and these symbols mean? Circulation. Vortex-like movement.
Vorticity. When a fluid element rotates in a fluid flow, it's called vorticity. The curl of a fluid's velocity vector at a particular point. Mathematically, it's the component of the local rotation vector that's perpendicular to the flow plane.
Weather patterns such as cyclones, anticyclones, and tornadoes are formed by vorticity. These weather phenomena can be caused by vorticity in a fluid flow.
Numerical weather prediction models use vorticity as a key parameter to forecast weather patterns. Storm fronts, low-pressure systems, and tropical cyclones can be predicted by analyzing the vorticity field. Understanding vorticity is crucial for forecasting because it explains fluid flow behavior and helps predict weather patterns.
To visualize vorticity, think about ceiling fans rotating. We plot it in circle radians per hundred thousand seconds using weather map symbols. It's a little longer than a day. Here's a bit about angles.
Convert radians to degrees
A complete circle takes a little over six radians. Actually, Pi multiplied by two (2π), or 6.28318530717958 to be a bit more precise.
Vorticity has two definitions. In fluid dynamics, including atmospheric and oceanic science, relative vorticity and absolute vorticity are related concepts. There's a small but important difference between them.
1. Relative vorticity - Air above the earth rotates horizontally due to relative vorticity. The relative vorticity of a fluid element is how much it rotates relative to the rotating Earth. Flows around corners, swirls, and eddies. These weather map symbols give that effect.
The curl of the relative velocity vector of a fluid at a particular point is the difference between the fluid's velocity and the Earth's rotation at that point. Relative vorticity is how much rotation you'd see if you were moving with the fluid.
Changes in speed over a horizontal distance, also called wind shear, create the same result. Look at a fast-flowing creek to see this relationship. Near the edges, the water flows slower than in the middle. There are little eddies.
In the shear zone, they look like whirling vortices. They redistribute water and energy.
Earth revolution rotation
Also, the earth rotates. By adding the two rotation vectors together, we get...
2. Absolute vorticity - Absolute vorticity takes the Earth's rotation into account. At a particular point, it's the sum of relative vorticity and Earth's rotation rate. Thus, rotation due to Earth's rotation is included in absolute vorticity.
In atmospheric and oceanic sciences, relative vorticity describes the development of weather patterns, like cyclones and anticyclones, while absolute vorticity describes large-scale circulation. So, the difference between relative and absolute vorticity is whether the Earth's rotation is taken into account.
Imagine a pencil sticking straight through the ground beside you. Your latitude determines how fast the earth rotates relative to the pencil.
The earth's circulation wouldn't circle the equator. The earth would spin around your pencil if you were at the North Pole. About seven radians per 100,000 seconds. I'll help you visualize this.
Where is the equator? Northern and southern hemispheres are divided by this circle. If our pencil were inserted into the ground here instead, the earth's rotation would carry it. Do you get it? Since the stick moves with the earth, none of the globe goes around it.
...and the line of longitude and latitude. What if we put our post at the North and South Poles? Everything else moves around while it stays static. Multiply by a fraction.
For points between the equator and the poles, it's the cosine of latitude. That's pretty much the whole world.
Angles in these weather map symbols
We use degrees per second for vorticity symbols. We use radians per second, where 1 radian is about 57°.
Typical values are like earth rotation speed. There's usually less than a ten-thousandth of a radian per second. Here's the velocity formula.
An edge's speed is just the radius times the angular velocity in radians per second. Multiply that by the cosine of the latitude for a twirling sphere like the earth. You'll get your rotation speed at any point. About 6400 km is the radius of our planet.
Upward vertical motion in the atmosphere is caused by positive relative vorticity. Clouds and precipitation are associated with positive vorticity, while clear skies and dry conditions are associated with negative vorticity. Cloud, drought, and rain forecasts can be improved by looking at vorticity patterns.
What's the deal with POP - probability of precipitation? Read the answer.
I mentioned the curl of a vector earlier. What does that mean? The relative vorticity is calculated from wind data using this idea. Calculate the difference between:
1) the change in southerly component of wind as you go east and
2) the change in westerly component of wind as you go north.
Meteorologists at Environment Canada try to pinpoint highs and lows. Winds at upper levels stretch or transport them intact based on current vorticity weather map symbols.
Vorticity shear and advection are the two mechanisms. The maximum and minimum weather map symbols can appear and disappear quickly. This makes it harder to track them from one map to the next. There's vorticity shear and advection.
#26
Article earth science news
Do you wish to receive additional information, earth science current events, and meteorological articles? Take a look at these.
Go back from Weather Map Symbols to the
Chasing Storms web page.
Search this site for more information now.
How many of these have you seen before?
The weather map symbols described here show air features beyond the ones you normally see.
Do you have concerns about air pollution in your area??
Perhaps modelling air pollution will provide the answers to your question.
That is what I do on a full-time basis. Find out if it is necessary for your project.
Have your Say...
on the StuffintheAir facebook page
Other topics listed in these guides:
The Stuff-in-the-Air Site Map
And,
Thank you to my research and writing assistants, ChatGPT and WordTune, as well as Wombo and others for the images.
GPT-4, OpenAI's large-scale language generation model (and others provided by Google and Meta), helped generate this text. As soon as draft language is generated, the author reviews, edits, and revises it to their own liking and is responsible for the content.


New! Comments
Do you like what you see here? Please let us know in the box below.